
Publication date:
Mar 05, 2025
IMF Data Brief: Global Annual Inflation and Industrial Production
February 19 – March 4, 2025
Steady and Slow Decrease in Global Annual Inflation, with Regional Variation
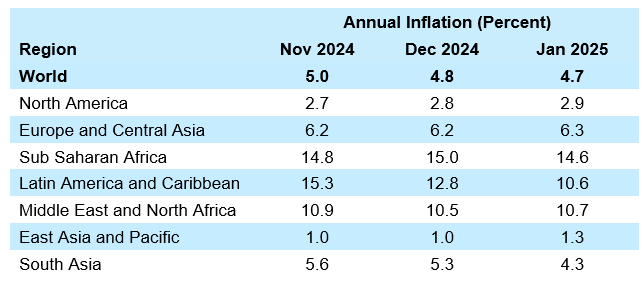
Inflation, Country Data, November 2024
(Contributors: Ragnhild Nygaard, Brian E. Graf and Abdulrahman Gweder)
Global annual inflation was 4.7 percent in January 2025, down from 4.8 percent in December 2024. Annual inflation, measured by 12-month change in the Consumer Price Index, has gradually and slowly declined since its 9.5 percent peak registered in September 2022. In the early post-COVID period, inflation decreased broadly across regions. More recently, global inflation decline has been driven by rapid disinflation in a few selected countries while elsewhere inflation rates have mostly stalled or even picked up somewhat.
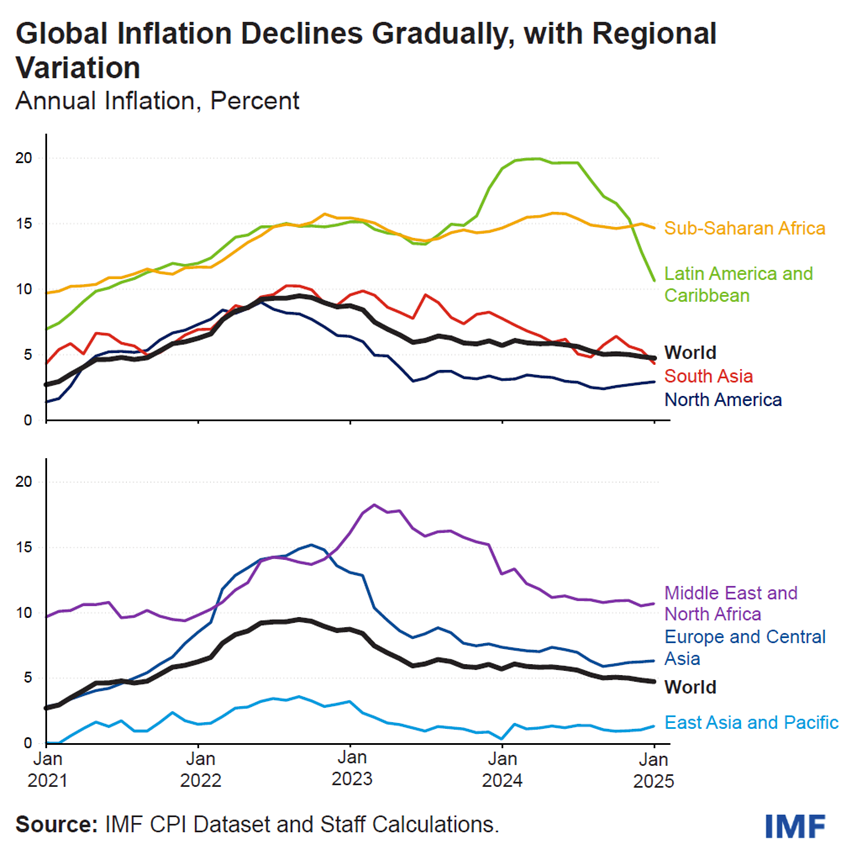
While the trends are broadly synchronized, annual inflation rates exhibit considerable variation across regions (and across countries within regions). In the last few years, the Europe and Central Asia region has been a key driver of the overall inflation, reflecting a combination of the region’s high weight in the global average and big swings in its inflation rate.

Notes: Global and regional annual inflation is calculated using geometrically weighted averages of officially disseminated Consumer Price Indexes (CPIs) and 2021 purchasing power parity (PPP) expenditure data.
Reference period and data source: January 2025, IMF CPI Database: 158 total economies at the global level, including 2 North America, 47 Europe and Central Asia, 39 Sub-Saharan Africa, 27 Latin America and Caribbean, 18 Middle East and North Africa, 18 East Asia and Pacific, and 7 South Asia economies.
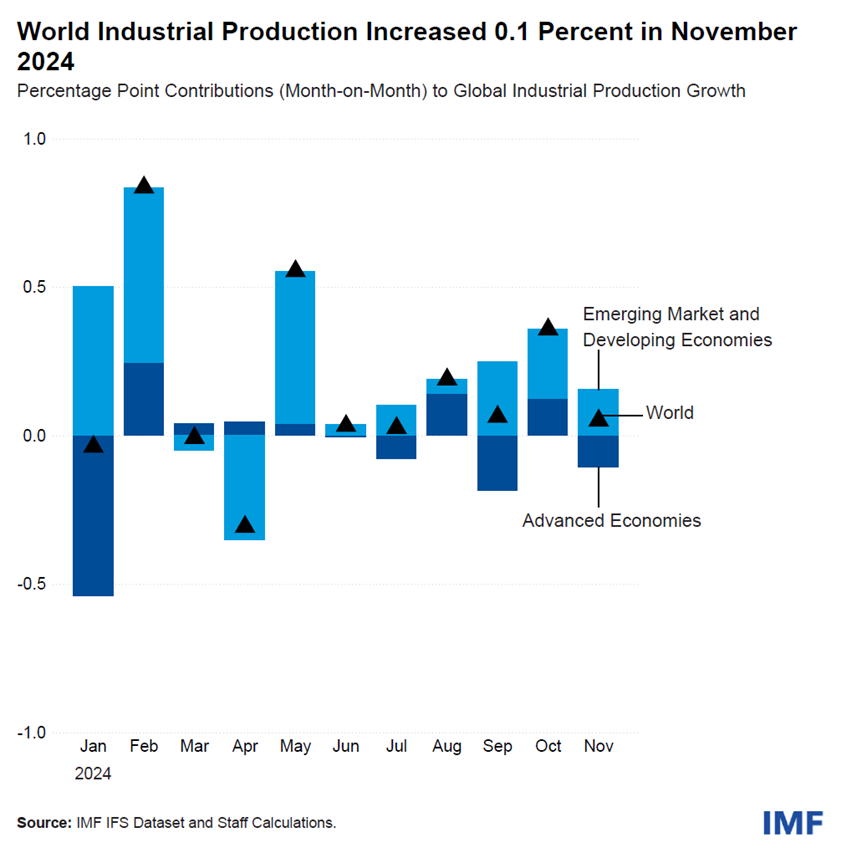
World Industrial Production Increased 0.1 Percent in November 2024
Country Data and Country Group Aggregates, November 2024 On a year-on-year basis, World IP increased by 2.3 percent in November, driven by a robust 3.6 percent growth in EMDEs, in contrast to a 1.0 percent decrease in AEs.
Notes : Seasonally adjusted World and Country Group Aggregate estimates are based on a sample of 118 economies that disseminate an Industrial Production (IP) index.
OTHER RELEASES
|
EMPOWERING THE WORLD WITH DATA
IMF Data is known for its high standard of quality and methodological consistency. With over 50 datasets updated regularly, you always have access to the latest global economic trends and forecasts as well as trusted data for cross country research and analysis.
Check our release calendar for upcoming releases:
