
Publication date:
Sep 17, 2025
IMF Data Brief: Quarterly Gross Domestic Product
World GDP Growth Holds Steady at 0.8 Percent in 2025Q2
Quarterly Gross Domestic Product (GDP), World and Country Group Aggregates, 2025Q2
(Contributors: Richard Wild and Huong Lan Vu)
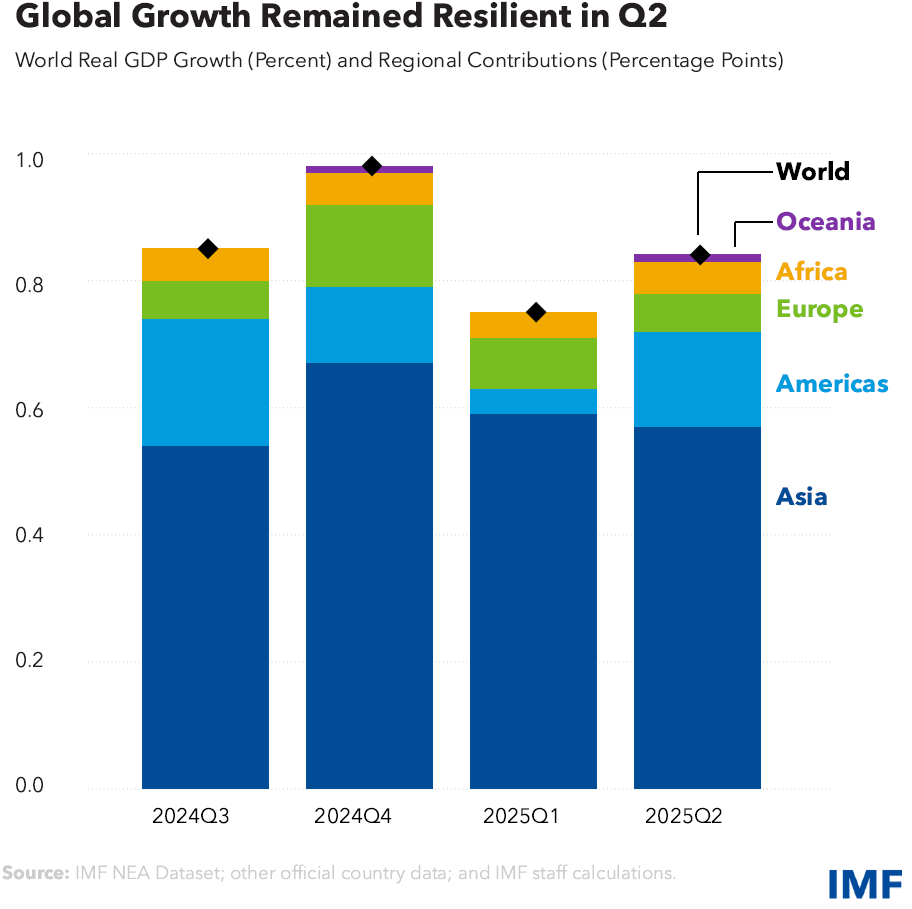
World GDP (real, seasonally adjusted) grew by 0.8 percent quarter—on—quarter in 2025Q2 following growth of 0.8 percent in the previous quarter (revised up from 0.7 percent), with a notable pickup in the Americas compared to Q1. Since the approximate end of the pandemic (from 2023Q1), World growth has averaged 0.9 percent, broadly in line with the pre-pandemic trend (from 2012Q1) of 0.8 percent.
Asia continued to drive the expansion, increasing by 1.1 percent and contributing 0.6 percentage points to global growth, though growth was a little below the post-pandemic average of 1.2 percent. The Americas saw stronger Q2 growth of 0.6 percent—in line with the post-pandemic trend—following 0.2 percent growth in Q1, with the region contributing 0.1 percentage points overall. Europe slowed slightly, from growth of 0.4 percent in Q1 to 0.3 percent in Q2, but still contributed 0.1 percentage points to World growth though growth was slightly below the recent trend. Africa grew by 1.0 percent in Q2, a little above the post-pandemic trend rate of 0.8 percent, and also contributed 0.1 percentage points overall. In Oceania, growth accelerated from 0.3 percent in Q1 to 0.6 percent in Q2, well above the recent trend (0.3 percent) though making only a marginal positive contribution overall due to this region’s small share of World GDP.
By economic classification, quarter-on-quarter real GDP growth in Emerging Market and Developing Economies increased 1.1 percent in 2025Q2, equal to growth in Q1 and trend growth since 2023Q1. This group contributed the bulk of World GDP growth (0.7 percentage points). Growth in Advanced Economies picked up to 0.4 percent in 2025Q2, also on trend, following 0.1 percent growth in the previous quarter, and contributed 0.1 percentage points to overall growth.
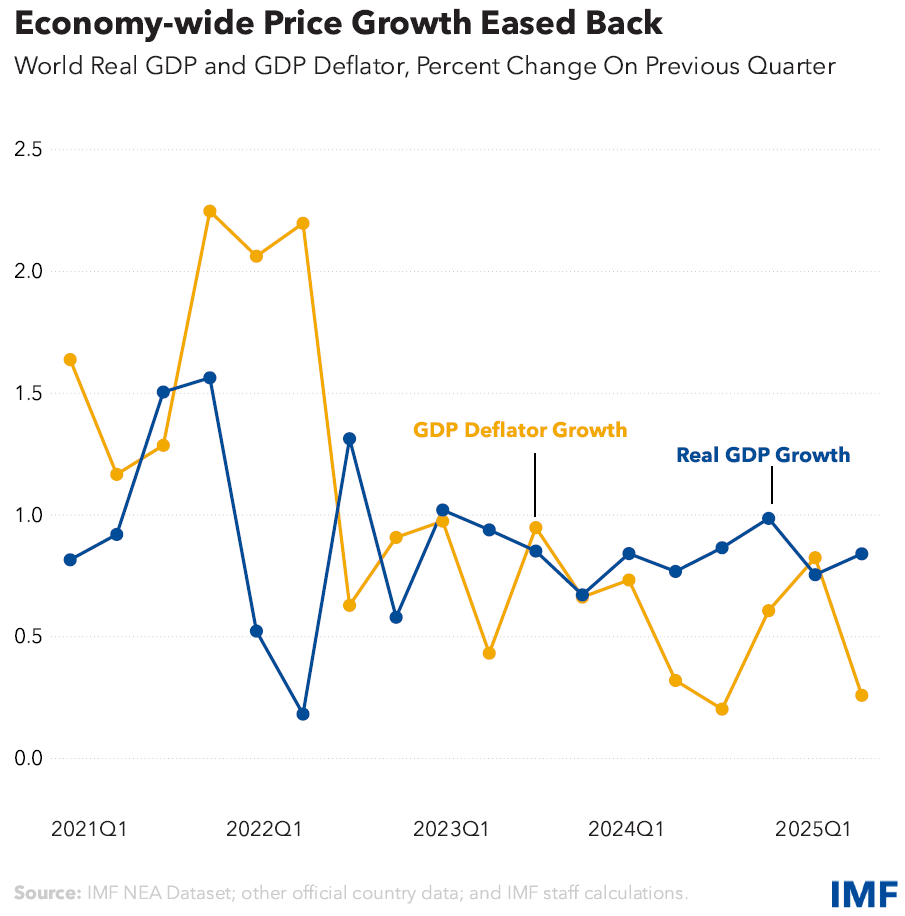
Economy—wide prices, as measured by the World GDP deflator, grew by 0.3 percent in 2025Q2, significantly slower than in Q1 and below the post-pandemic average of 0.6 percent. Prices declined by 0.4 percent in Asia in Q2, and in the Americas, price growth eased from 1.2 percent in Q1 to 0.6 percent in Q2. In Africa, price growth increased from 3.1 percent in Q1 to 4.6 percent in Q2. In Europe, price growth remained subdued at 0.4 percent in Q2, while in Oceania growth was broadly flat.

Notes: ¹Contributions to World growth may not equal the totals due to rounding. 2Based on 19 country members; excludes the European Union and African Union blocs.
World and country aggregate current price estimates reflect aggregate reported current price country data adjusting to international dollar purchasing power parity (PPP) terms which are then benchmarked up to the last full calendar year (2024) to annual nominal GDP World and country aggregate levels published in the IMF’s latest World Economic Outlook (WEO) release (April 2025). World and country aggregate constant price estimates reflect weighted aggregates of reported constant price country data adjusted to PPP terms, from which growth rates are then benchmarked to the annual constant price World and country aggregate growth rates published in the latest WEO.
Cross-border Portfolio Investment Assets Continue to Expand Amid Heightened Uncertainty
Portfolio Investment Positions, Country Data, December 2024
(Contributors: Silvia Amiel, Evrim Bese Goku, Rita Mesias, Wilson Phiri, Bedri Zymeri, and Arushi Kapoor)
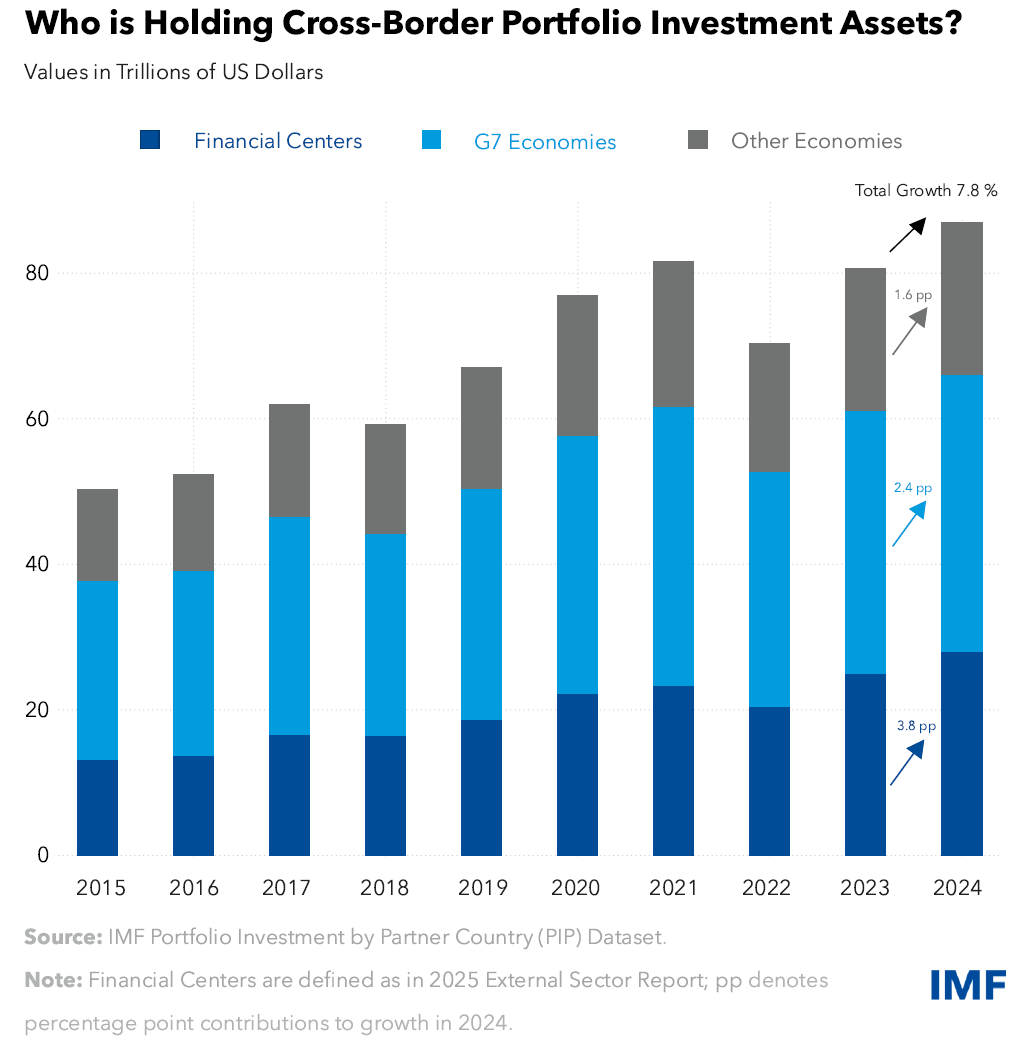
Amid global uncertainty, cross-border portfolio investment (CBPI) assets continued to expand, reaching US$86.9 trillion at the end of 2024—a 7.8 percent increase from the previous year.
At the end of 2024, G7 economies accounted for 43.8 percent of total CBPI assets, contributing 2.4 percentage points to the year’s CBPI growth. Meanwhile, financial centers held about one third of the total CBPI assets, adding 3.8 percentage points to the CBPI growth in 2024.
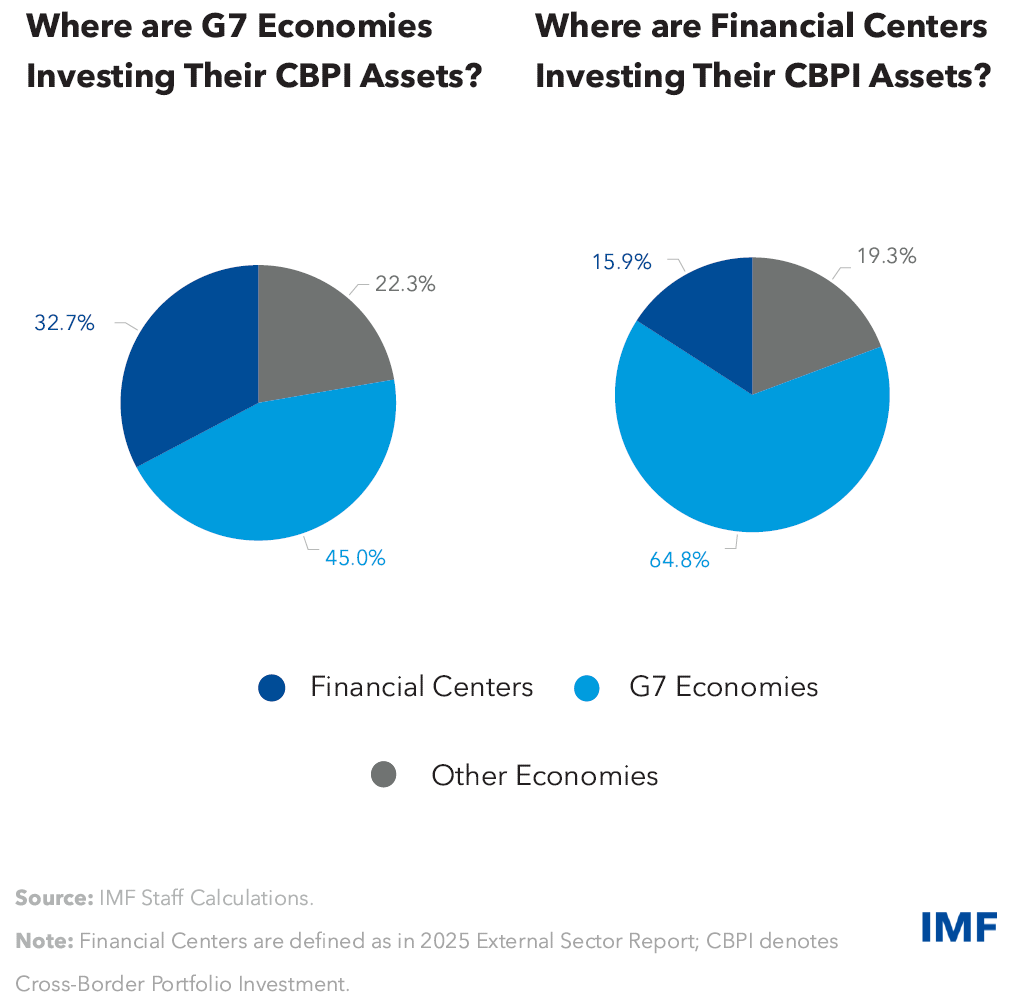
G7 economies show a strong preference for investing in other G7 economies and in financial centers, with 77.7 percent of their CBPI assets allocated to these recipient economies. Additionally, 64.8 percent of investments originating from financial centers economies are ultimately directed towards G7 economies.
Notes: The Portfolio Investment Positions by Counterparty Economy (formerly CPIS) aggregates used in this analysis are adjusted for coverage, excluding countries that do not report consistently across years. On average, this adjustment accounts for 0.1 percent of the total. Without adjustments, CBPI assets increased by 7.7 percent, reaching US$86.9 trillion.
Financial centers are defined according to the 2025 External Sector Report and include: Belgium, Bermuda, Bahrain, The Bahamas, Barbados, British Virgin Islands, Cayman Islands, Curaçao, Cyprus, Guernsey, Hong Kong SAR, Ireland, Isle of Man, Jersey, Luxembourg, Malta, Mauritius, the Netherlands Antilles, Panama, Singapore, Switzerland, Taiwan Province of China, and Turks and Caicos. When shown as reporters, only those providing PIP data are included.
The IMF’s Portfolio Investment Positions by Counterparty Economy is a bi—annual survey that provides data on CBPI assets by counterparty economy, sector of holder, and sector of nonresident issuer. For selected economies, the dataset also includes the currency of distribution of such holdings. 83 economies report CBPI assets data to the IMF. Comprehensive time—series data are available in the Portfolio Investment Positions by Counterparty Economy database at https://data.imf.org/
The methodological framework underpinning the Portfolio Investment Positions by Counterparty Economy is consistent with the IMF’s Balance of Payments and International Investment Position Manual, Sixth Edition (BPM6), as well as the Coordinated Portfolio Investment Survey Guide.
The next data release-covering position as of end-June 2025—is scheduled for publication in March 2026. For further information or specific inquiries, please contact the CPIS team at cpis@imf.org
OTHER RELEASES
Quarterly GHG EmissionsWorld and Country Group Aggregates, Q12025
Quarterly GHG Emissions for First Quarter, 2025 were released on September 3, 2025. The OECD Air Emission Accounts database presents estimates that align with the classifications, concepts and methods consistent with the System of Environmental-Economic Accounting Central Framework (SEEA-CF). |
Atmospheric CO₂ ConcentrationsGlobal Data, August 2025
Atmospheric CO₂ Concentrations for August 2025 were released on September 17, 2025. The IMF Climate Change Indicators Dashboard tracks monthly global atmospheric carbon dioxide concentrations. |
Global Debt DatabaseGlobal Data, 2024
Global Debt Database for 2025 was released with data through 2024 on September 17, 2025. The Global Debt Database (GDD) is the result of a multiyear investigative process that started with the October 2016 Fiscal Monitor. The dataset comprises total gross debt of the (private and public) nonfinancial sector for an unbalanced panel of 190 advanced economies, emerging market economies and low-income countries, dating back to 1950. |
EMPOWERING THE WORLD WITH DATA
IMF Data is known for its high standard of quality and methodological consistency. With over 50 datasets updated regularly, you always have access to the latest global economic trends and forecasts as well as trusted data for cross country research and analysis.
Check our release calendar for upcoming releases:
